Principles of Mass Spectrometry
Mass spectrometry is a powerful analytical technique used to measure the mass-to-charge ratio of ions. It can determine the relative atomic mass of an element and is widely used in the identification of organic compounds.
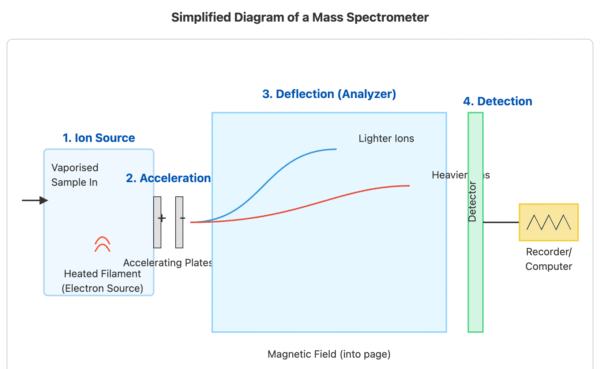
The process involves several key stages:
- Vaporisation: The sample is heated and vaporised to produce gaseous atoms or molecules.
- Ionisation: The gaseous particles are bombarded with high-energy electrons, which knock out one or more electrons from each particle to form positive ions.
- Acceleration: The positive ions are accelerated by an electric field so that they all have the same kinetic energy.
- Deflection: The ions are deflected by a magnetic field. The amount of deflection depends on the mass and charge of the ion; lighter ions and ions with a higher charge are deflected more.
- Detection: The deflected ions are detected by a device that measures their abundance. The detector is connected to a computer which generates a mass spectrum.
Interpreting Mass Spectra
A mass spectrum is a graph that plots the mass-to-charge ratio (m/e) on the x-axis against the relative abundance of ions on the y-axis.
- For ions with a single positive charge, the m/e ratio is equal to the relative mass of that isotope.
- The height of each peak indicates the relative abundance of each isotope present in the sample.
Calculating Relative Atomic Mass
The data from a mass spectrum allows for the precise calculation of an element’s relative atomic mass (Aᵣ). The following formula is used:
Aᵣ = Σ (isotopic mass × relative abundance) / 100
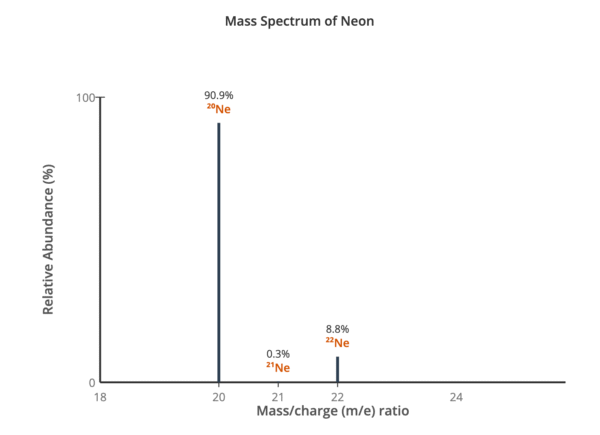
For example, using the data for neon (⁹⁰.⁹% ²⁰Ne, ⁰.³% ²¹Ne, ⁸.⁸% ²²Ne):
Aᵣ of neon = ((20 × 90.9) + (21 × 0.3) + (22 × 8.8)) / 100 = 20.2
Mass Spectrometry for Organic Compounds
Mass spectrometry is a vital tool for identifying organic molecules.
Molecular Ion Peak (M⁺)
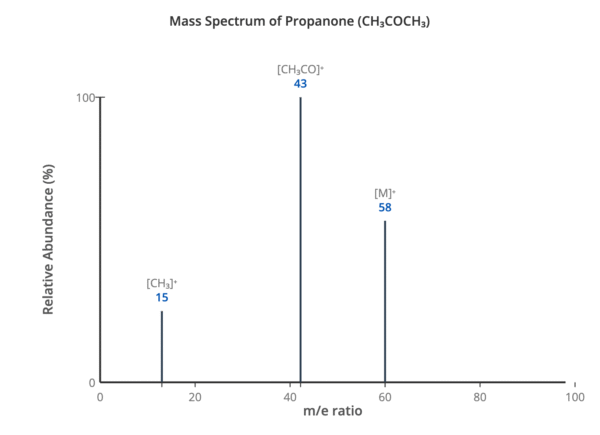
The peak with the highest mass-to-charge ratio is the molecular ion peak (M⁺). This is caused by the molecule losing one electron. This peak gives the relative molecular mass of the compound.
Fragmentation Patterns
The high-energy electrons in the ionisation chamber can cause covalent bonds within the organic molecule to break, creating smaller, positively charged fragments. These fragments are also detected, creating a series of peaks at lower m/e values. The fragmentation pattern is unique to a specific molecule and can be used for identification.
Common fragments include:
- 15: ⁺CH₃
- 29: ⁺C₂H₅
- 43: ⁺C₃H₇ or ⁺CH₃CO
Using Isotope Peaks
High-resolution mass spectrometry can reveal additional peaks resulting from isotopes of atoms within the molecule.
- The [M+1] Peak: A small peak is always observed one unit beyond the molecular ion peak. This is due to the presence of the carbon-13 isotope (¹³C). The height of the [M+1] peak relative to the M⁺ peak can be used to determine the number of carbon atoms in the molecule.
- The [M+2] Peak: A prominent peak two units beyond the M⁺ peak indicates the presence of chlorine or bromine.
- Chlorine: If one chlorine atom is present, the ratio of the heights of the M⁺ peak to the [M+2] peak is approximately 3:1 (due to ³⁵Cl and ³⁷Cl isotopes).
- Bromine: If one bromine atom is present, the ratio of the heights of the M⁺ peak to the [M+2] peak is approximately 1:1 (due to ⁷⁹Br and ⁸¹Br isotopes).